
Time. Trends. Transformation.
October 20, 2026
W.D Geometrical Angles
This is a scanned page titled “Geometrical Angles” from a book on W. D. Gann’s method of market analysis. I’ve summarized it in my own words rather than transcribing it, and the diagram above is my own schematic illustration of its main idea, not an image from the Article..
What the page looks like
- A single page of typewritten, justified text with a small centered heading, “GEOMETRICAL ANGLES”, and a dotted line underneath.
- About ten paragraphs, with no charts, tables or drawings on the page itself.
- A few underlined words, and some spelling quirks typical of old typewritten text.
What it says, paragraph by paragraph
- Opening claim. After long years of practical experience, the author says he found that geometrical angles measure space, time, volume and price accurately.
- Why mathematics. He calls mathematics the only exact science. His argument is that people everywhere agree that 2 and 2 make 4, while experts in other fields, such as scientific disagreements, often argue over the same problem. Calculation, he says, leaves no room for that.
- The 360-degree circle. A circle has 360 degrees however large or small it is. Certain numbers of these degrees and angles are of vital importance and point to important tops and bottoms, and to resistance levels. If you master the geometrical angles, you can solve any problem and find the trend of any stock.
- Study advice. After 25 years of research, tests and practical use, he says he has proven which angles are best for determining the trend of the stock market. He tells the reader to concentrate on those angles and experiment with each rule until they are thoroughly understood.
- Why angles instead of arithmetic. Angles are used to measure space and time because they are sharper and quicker than addition or multiplication. If you follow the rules and draw angles accurately from tops and bottoms, or from extreme highs and lows, mistakes in addition or multiplication will be corrected by the drawing.
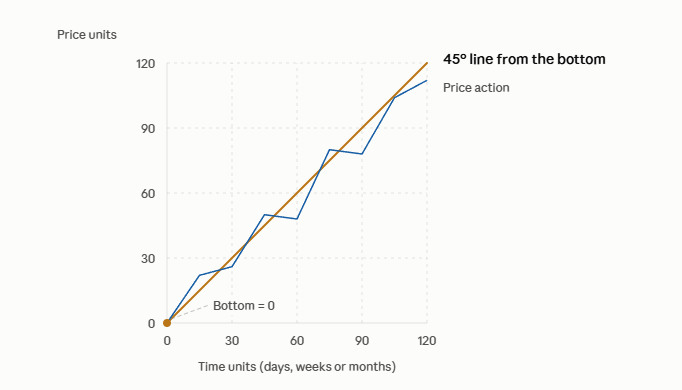
- Worked example. Suppose the chart is scaled with 120 units across the bottom (days, weeks or months). Start at “0” at the bottom, number upward to 120, and draw a 45-degree line from the bottom to the top point at 120. A numbering mistake would then show up in the geometry.
- Angles show the trend. Angles drawn on a chart show where the stock stands relative to its trend, so you won’t mislead yourself or miss a resistance point by guessing. They are “always there in front of you”.
- Rules matter. Drawn correctly, these angles or moving-average trend lines will keep you from mistakes about the trend. Following the rules will show when the trend changes.
- Moving average. The page begins to explain how the usual moving average is taken, using the extreme high and low of a period and averaging them. It then says this is irregular in spaces or points per week, because at one time it may move up two points and at another, fewer. The page ends mid-explanation.
The diagram
The diagram shows the 45° idea from paragraph 6. A square 120 × 120 grid has a line rising from a bottom at zero, one price unit per time unit. The zigzag blue line is an example of price action moving along it.
Notes
- Page text is typewritten and clean enough to read. I’m confident in the paragraph summaries, but if you need exact wording for something you’re publishing, you’ll want to work from the original book.
- The page only introduces the 45° angle. The book’s other angles (such as 2×1 and 1×2) aren’t on this page, so I didn’t draw them.
- If this is for your Astrotechnicals marketing, I can turn this summary into a short explainer script or a Shorts outline.